Research

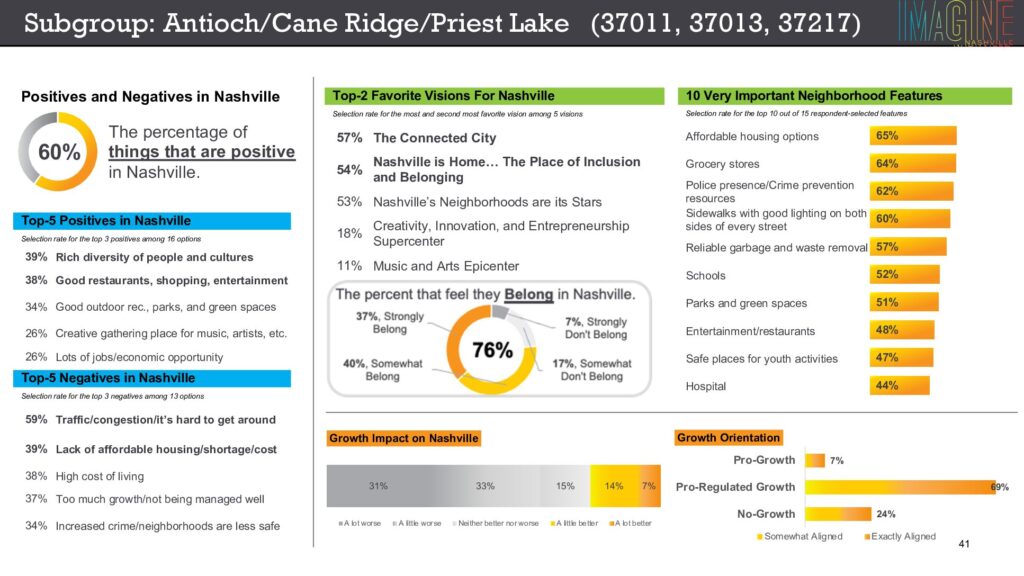
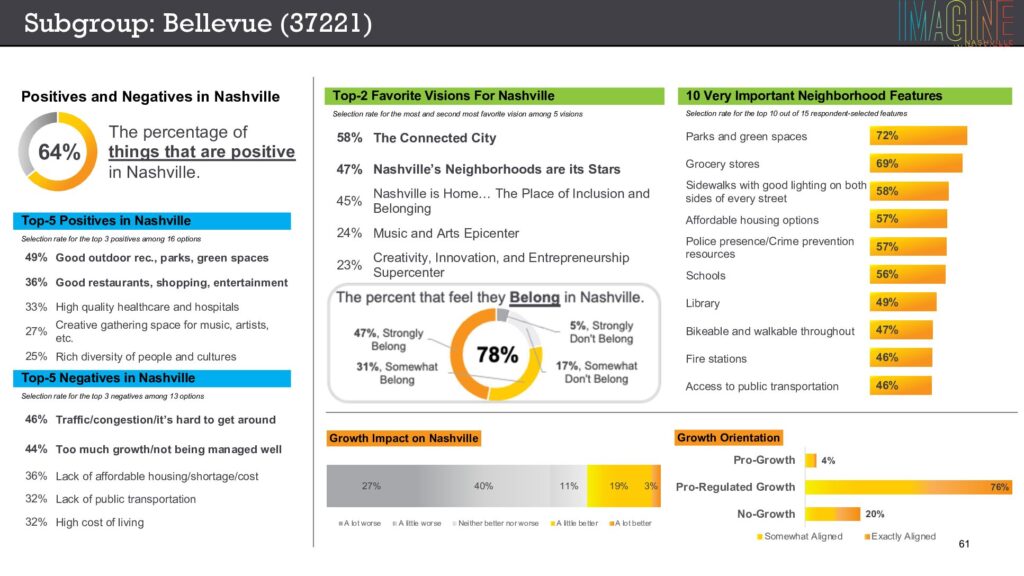
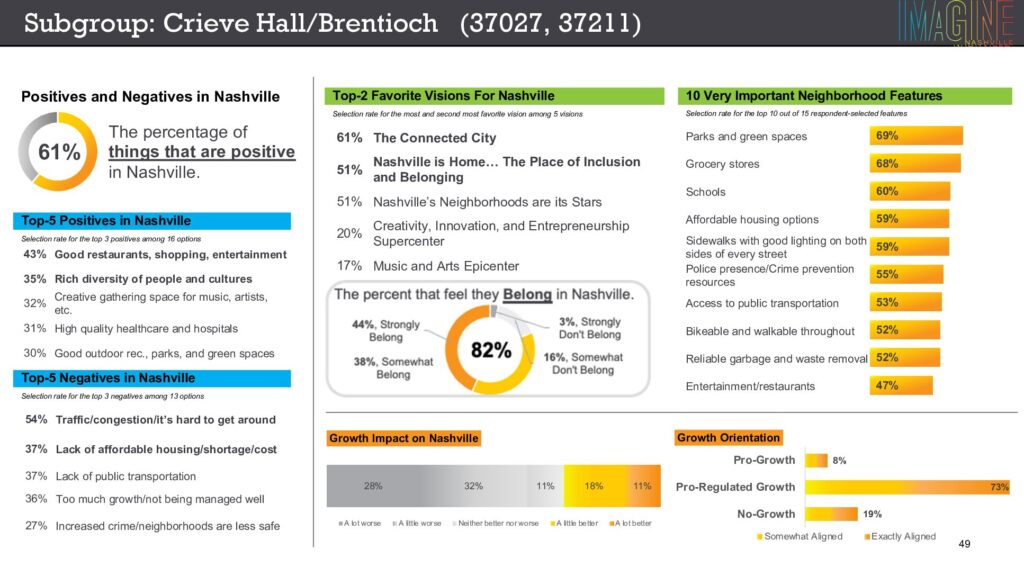
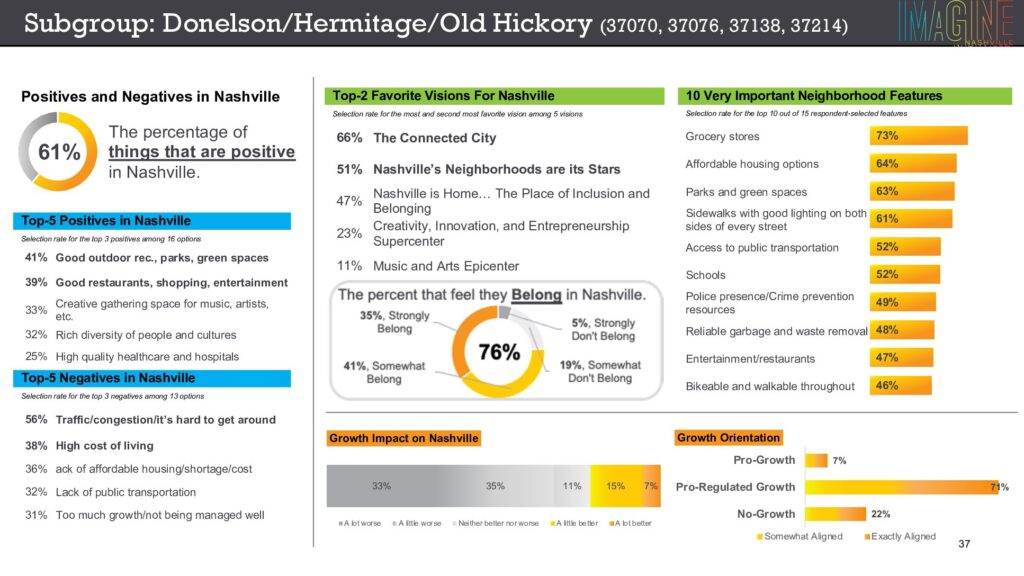
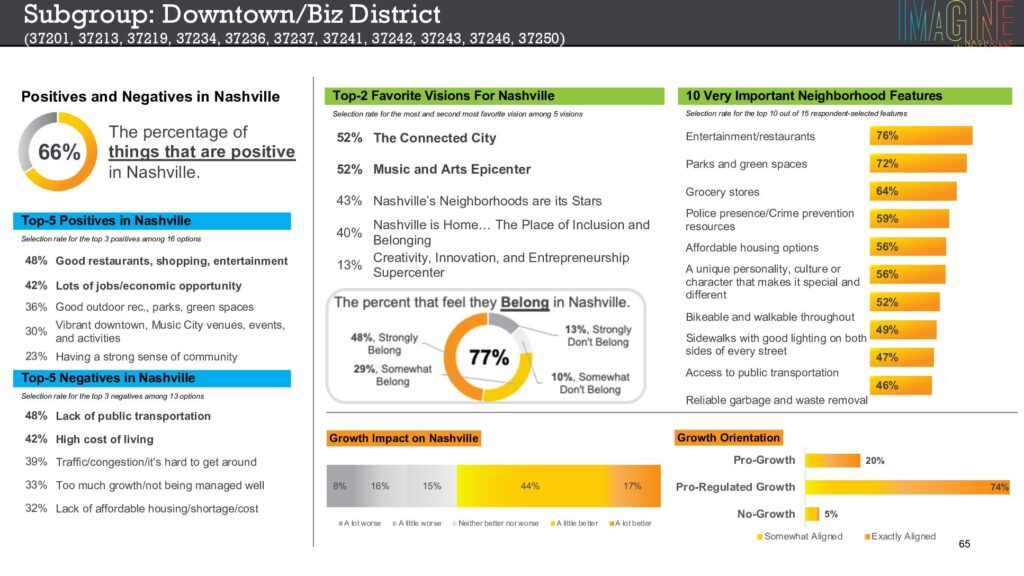
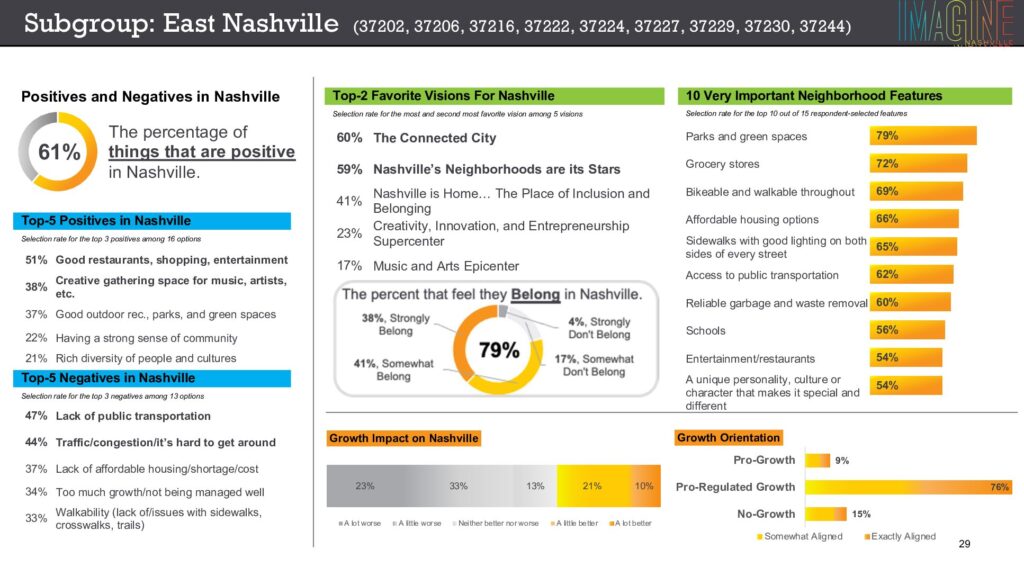
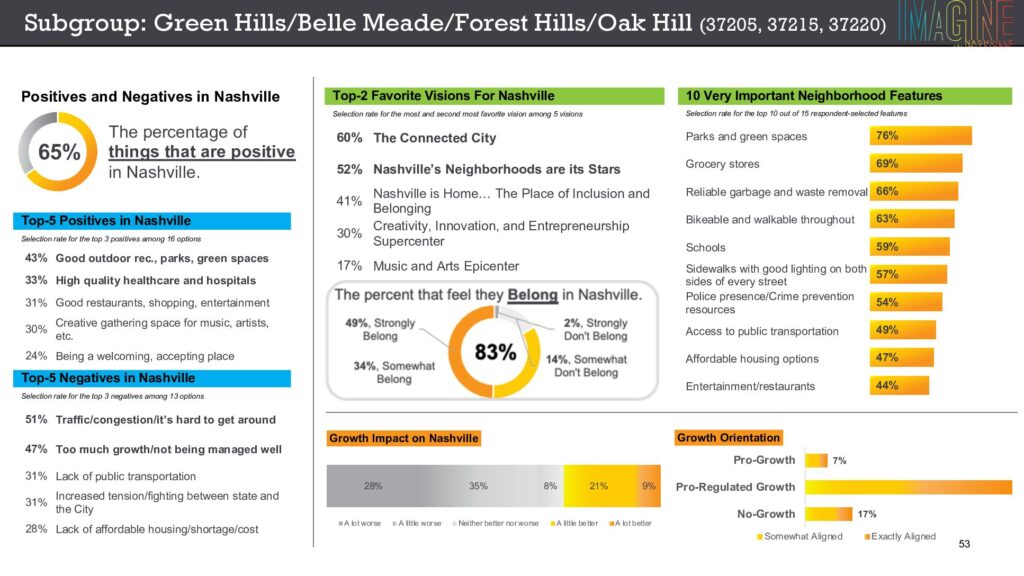
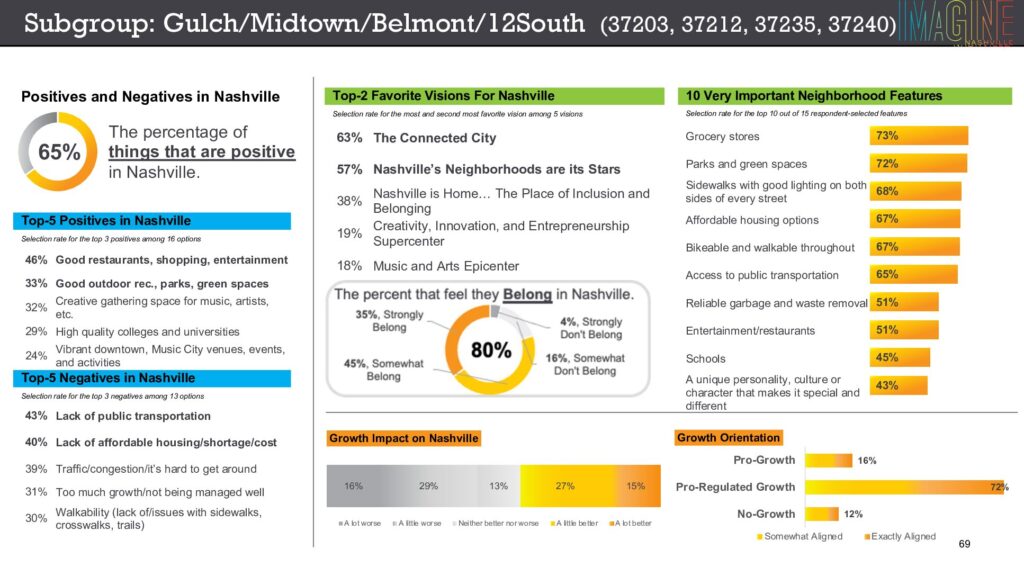
Imagine Nashville undertook an unprecedented level of community research including 1:1 interviews, weeklong online community conversations, and survey research. Every effort was made to engage young people and older adults alike, often under-represented populations, and residents in every neighborhood and ZIP code in the city.

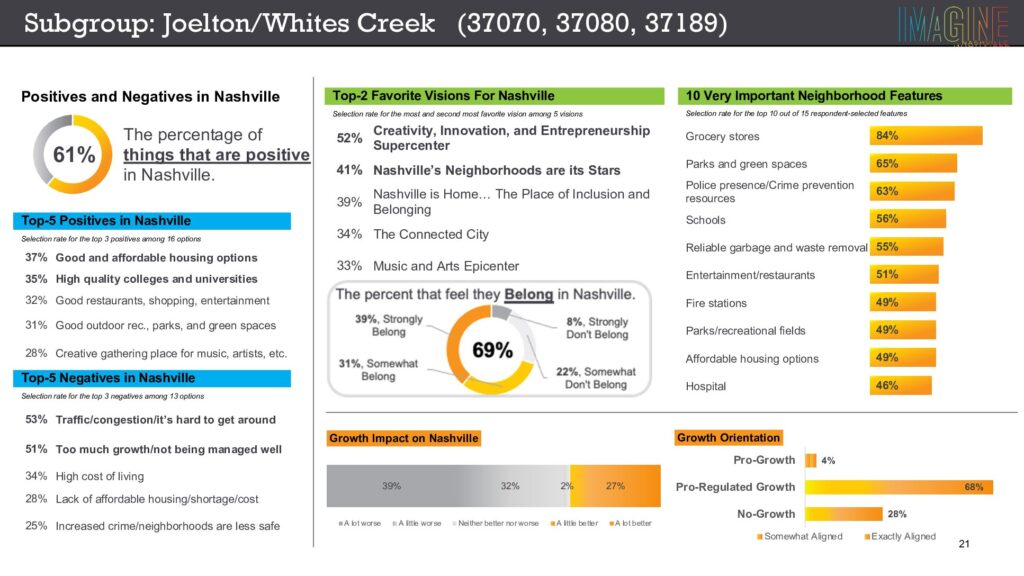
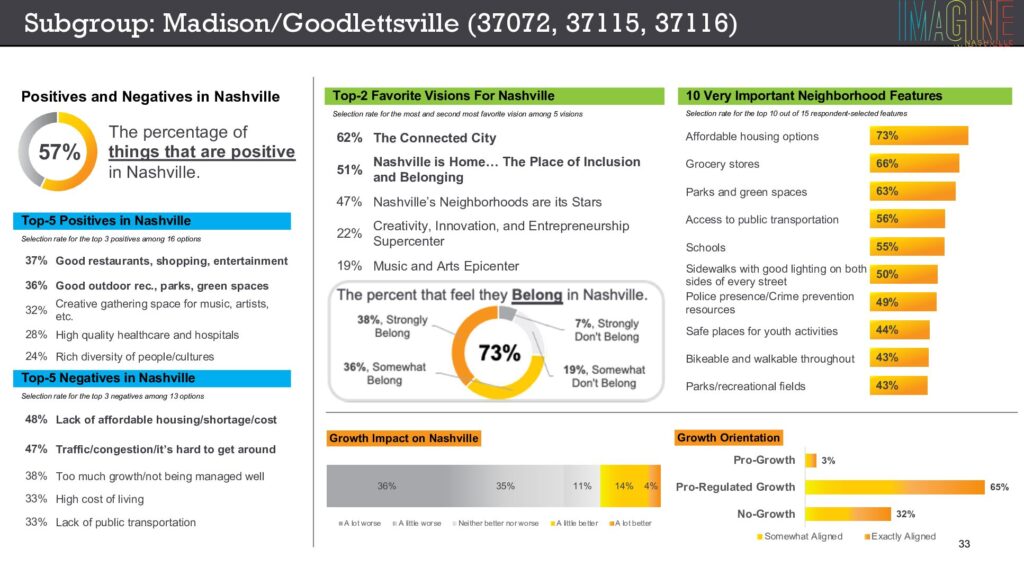
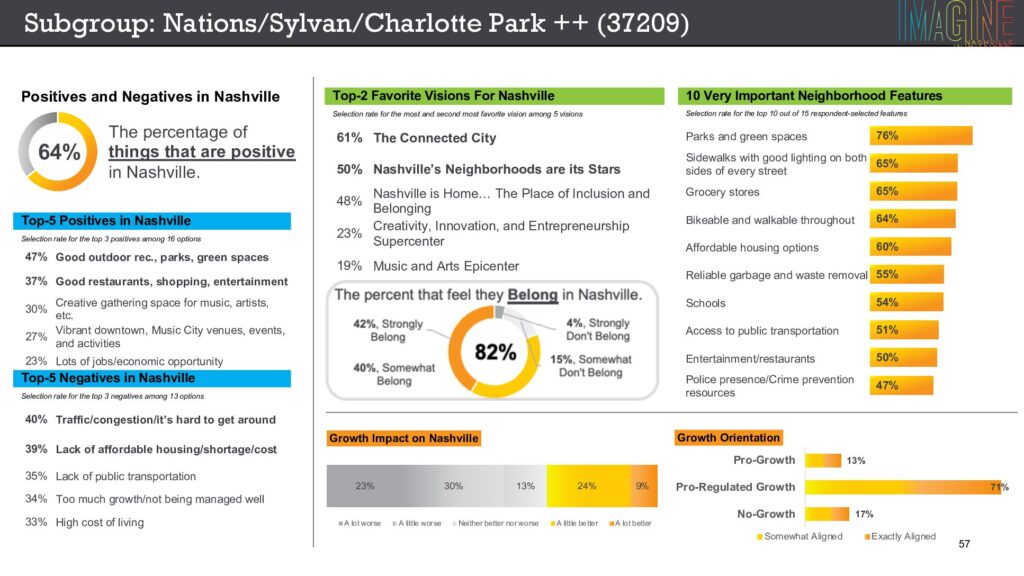
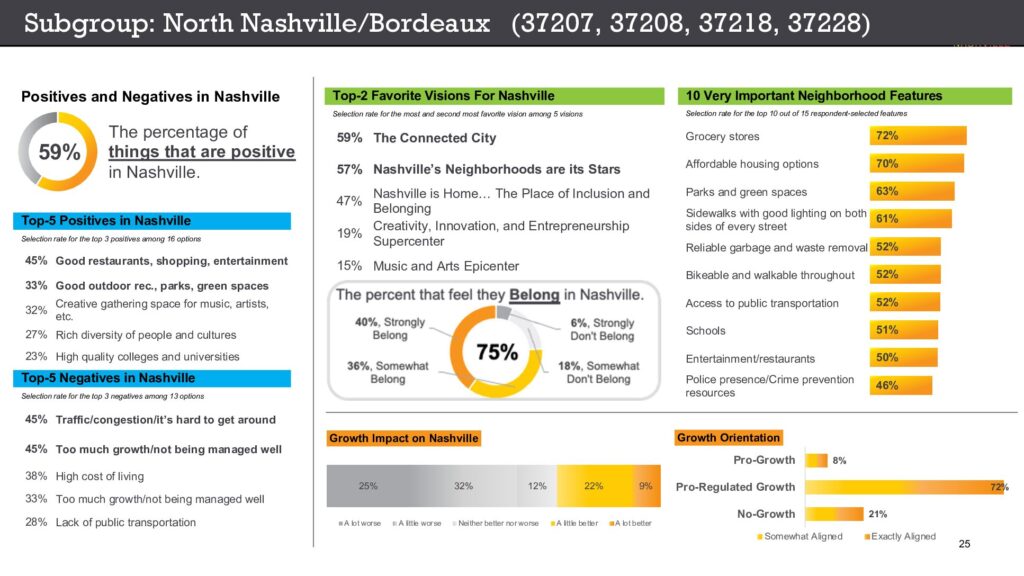
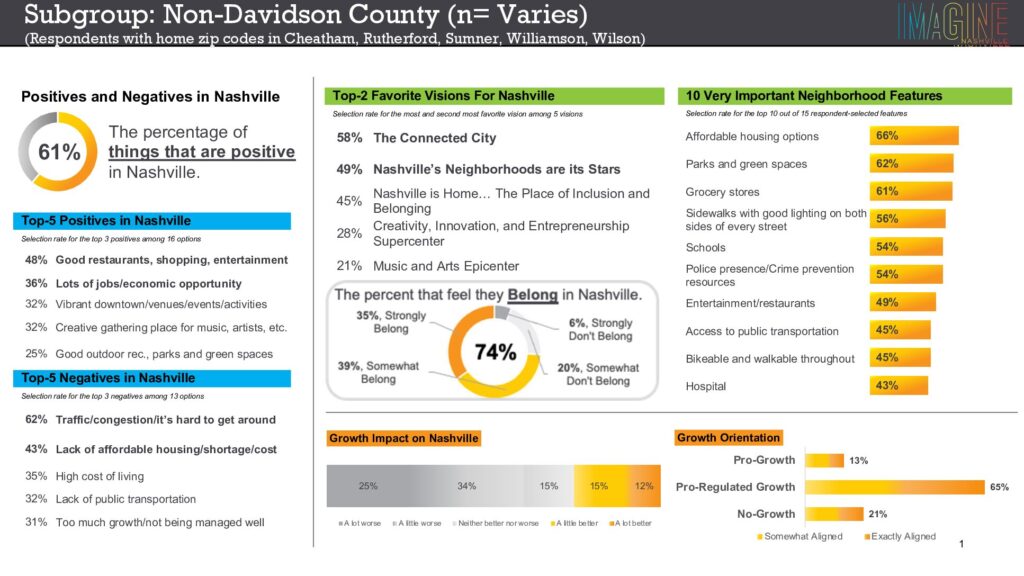
The research reveals clear insights into what Nashvillians want and need to feel like they belong here. Explore and download the dashboards below featuring data by neighborhood and various other categories. Ultimately, in partnership with the Community Foundation of Middle Tennessee, all of the data will be available on an open-access platform for anyone to access.

Key Research Highlights – Adults Key Research Highlights – Youth

Key Research Highlights – Adult

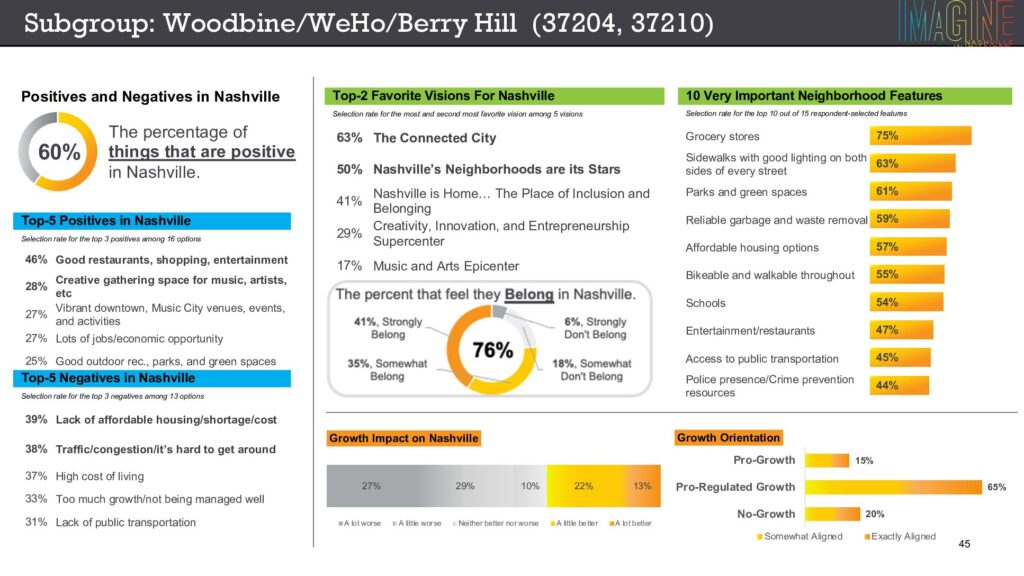
  • Nashvillians say 65% of things are positive in Nashville and 57% of adults see their quality of life getting better in the future.
  • Yet, the research raises several red flags about whether the city’s amenities are equitably shared with residents and whether priorities and focus are on the right things. For example, 72% of Nashvillians see “a growing divide between rich and poor” and 72% believe “leaders in Nashville are investing too much money in the wrong things” rather than “the people that live here.”
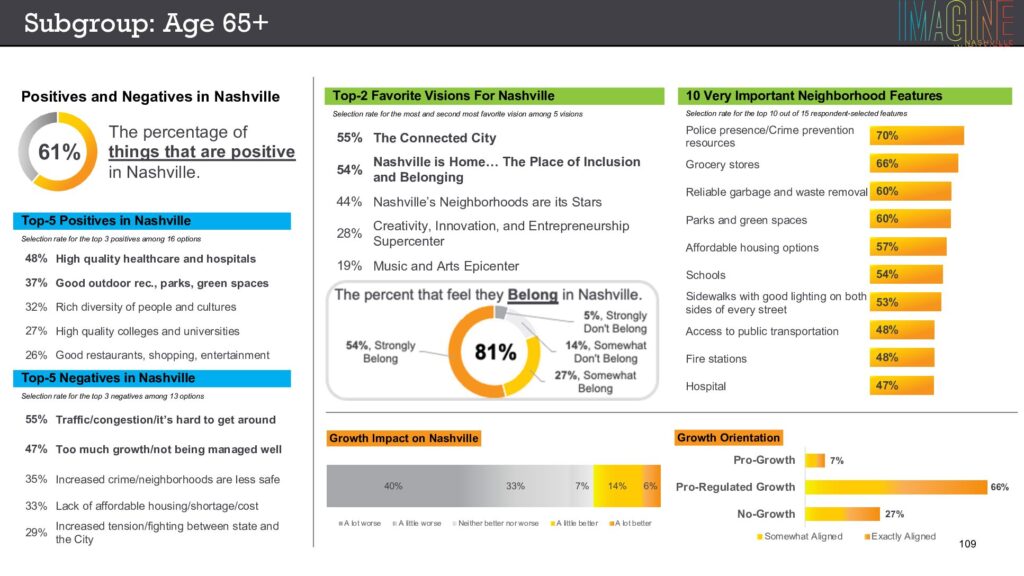
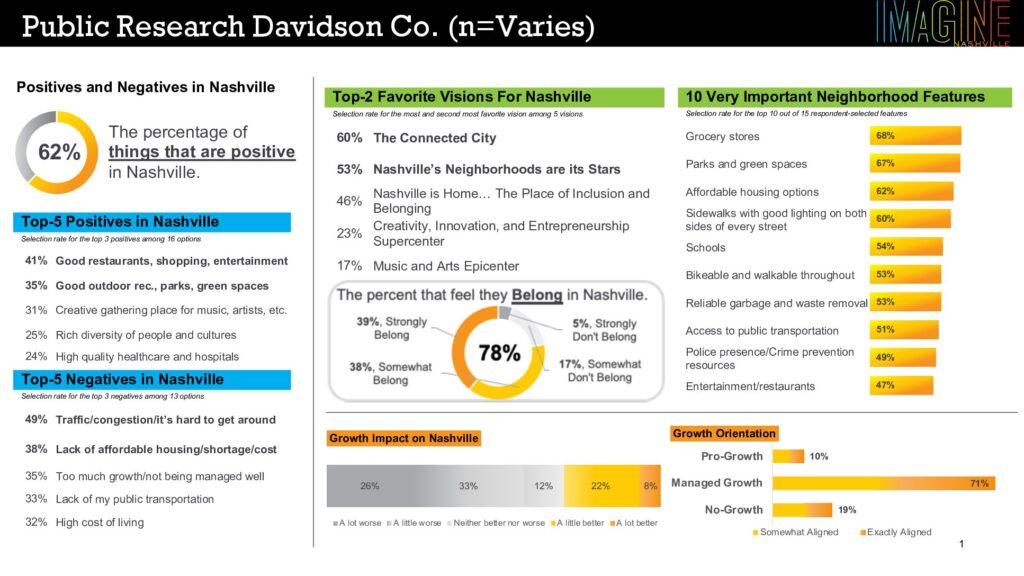
  • While the strong sense of community and feeling of belonging is seen as a major differentiator for Nashville, there are significant differences in belonging vs. feeling included in the benefits of the city (39% strongly agree + 38% somewhat agree they belong; 22% feel they don’t belong).
  • In particular, some key constituencies feel particularly left behind, including 57% of low-income families as well Older Nashvillians (65+), Black people and the LGBTQ+ community. People with lower educational attainment and those who feel they are not in an ideal neighborhood also feel left behind.
  • The positives of living in Nashville are largely driven by all the good restaurants and  shopping/entertainment, by having good parks and green space, and by being a creative gathering space for music and artists. Unfortunately, these are not the most important or impactful drivers of quality of life for more Nashvillians.
  • The things that are most impactful on quality of life, by contrast, are the very things Nashville is NOT doing well:
    • Traffic/congestion/it’s hard to get around (49% selected as Top 3 most “negative impact on your  life”)
    • Lack of affordable housing/housing shortage/high cost of living (38%)
    • Too much growth/growth not well managed (35%)
    • Lack of public transportation (33%)
    • High cost of living (32%)
  • Currently, a majority of Nashvillians believe growth is making things worse (only 29% of adults and 35% of youth feel growth is making things better). That said, 71% of Nashvillians agree that growth brings mostly benefits and advantages if it is more carefully managed.
  • Neighborhoods are another big issue in Nashville, and Nashvillians see the future success of the city being built on a network of strong neighborhoods rather than just a strong city center. With that in mind, about four in ten (38%) of Nashvillians feel they live in an “ideal neighborhood,” 10% feel they live in “one of the worst” neighborhoods, and 52% feel their neighborhood is somewhat “in between.”
  • To make a neighborhood great, there are several key components Nashvilllians feel need to be in every neighborhood:
    • Grocery stores (84% rate as “absolutely essential/very Important”)
    • Parks and green spaces (84%)
    • Sidewalks and lighting (78%)
    • Range of housing options/price points (73%) – of note, nearly half say affordable housing is an absolute essential in their ideal neighborhood.
  • Specific to transit, our research showed widespread public support for investing in public transit with 74% of Nashvillians strongly agreeing. In comparison to similarly sized cities, support for investing in public transit is much higher in Nashville (74% vs. 19% strongly agreeing).
  • When it comes to housing, Nashvilllians clearly associate housing attainability as a driver of affordability more broadly. Lack of affordable housing was not only a top concern of most neighborhoods around the city, but more fundamentally, the majority of Nashvillians feel it is most important to have more variety of housing options and pricing in all neighborhoods (52%). To that end, most Nashvillians prioritize solutions that increase incentives for private developers to get them to build more affordable options.
  • A supermajority of Nashviillians (90%) agree investment in public education is a top priority. Better recruitment, compensation and training for teachers and a focus on early childhood education, in particular, rise to the top of the list of “to do’s.”

Link Here To Final Release

Survey Methodology

Several components contributed to the Imagine Nashville survey research and the 10,000+ community respondents in 100 days. Most notably, a blend of survey methodologies were deployed including online, phone, and in person conversations — even mobilizing field teams to reach into key communities and constituencies. In addition, there were dedicated efforts to engage specific Nashville populations between August and November 2023:

  • Young people (in partnership with the Civic Design Center and Vanderbilt University),
  • Often under-represented populations (in partnership with The Equity Alliance), and
  • Residents in every neighborhood and ZIP code in the city (in partnership with dozens of community partners)

Importantly, a portion of the interviews were conducted by means of rigorous scientific research methodologies which allow more accurate and precise statistical representation of the city and its people. Data reported in this news release come from this portion of the survey and are described here. For this portion of the research, phone and online interviews were completed with a large and representative sample of 1150 Nashvillians 18 and older which were designed to match key demographic characteristics of the city according to the U.S. Census based on age, gender, geography, and race/ethnicity. To lend greater insight and accuracy, an oversample of Black/African-American (n=75) and Hispanic/Latino (n=75) was included. This portion of the research was conducted August 19 to September 5, 2023. 

In a hypothetical case of a probability sample size of 1150, the margin of error would be +/- 3% at the 95% confidence level.

Key Research Highlights – Youth

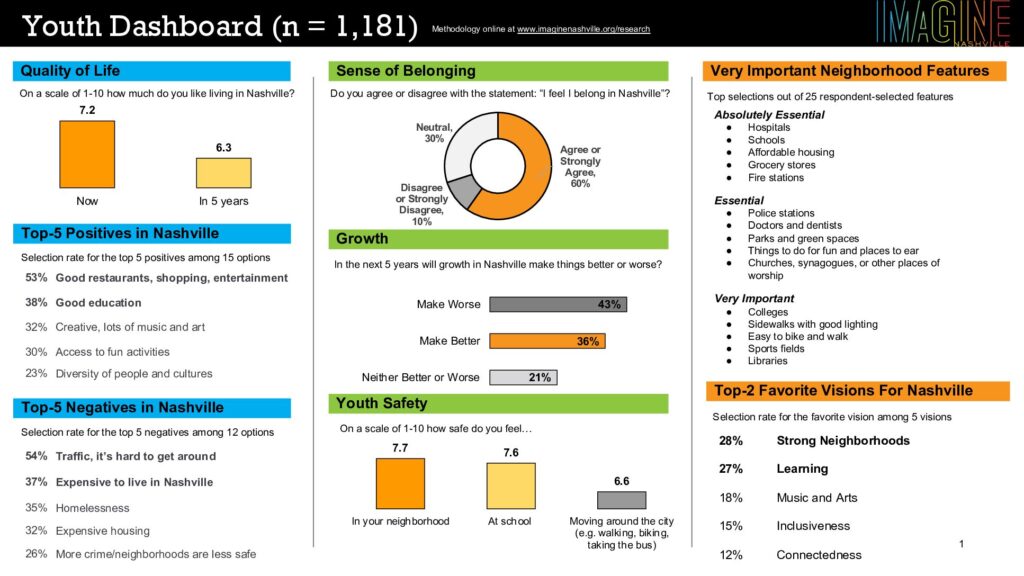
  • Sense of Belonging: Overall, 60% of youth surveyed “Agree or Strongly Agree” that they belong in Nashville. However, the data vary widely when you compare across racial and ethnic identities as well as type of school setting. 72% of White youth surveyed “Agree or Strongly Agree” that they feel like they belong in Nashville, whereas 47% of Middle Eastern or North African youth surveyed, 48% of Black youth surveyed, and 46% of youth surveyed identifying as Two or More Races/Ethnicities “Agree or Strongly Agree” that they belong in Nashville. Youth surveyed who attend private schools were more likely to state that they “Agree or Strongly Agree” that they feel like they belong in Nashville (74%) compared to youth surveyed who attend public schools (53%) and youth surveyed who attend charter schools (47%).
  • Growth of Nashville: 43% of youth surveyed who attend public schools and 50% of Hispanic youth surveyed felt that growth would make Nashville “a little better or a lot better” in the next 5 years whereas survey participants who were older (14-18 years old), White, or attend private schools most often shared that they think growth will make Nashville “a little worse or a lot worse.”
  • Safety: Compared to how safe they feel at school (average = 7.55) and in their neighborhood (average = 7.70), young people surveyed feel the least safe moving around the city (walking, biking, taking the bus, riding in the car; average = 6.62). White survey participants felt safer at school, in their neighborhood, and while moving around the city than participants from all other racial and ethnic identities. Survey participants attending private school felt safer at school, in their neighborhood, and while moving around the city than survey participants attending public or charter schools.
  • Things Young People Like About Nashville: Good restaurants, shopping and entertainment, and good education were among the top three things survey participants like about living in Nashville among all age groups and types of schools participants attend. They were also among the top three things survey participants like about living in Nashville for participants who identify as Asian, Black, Hispanic, MENA, white and other race or ethnicity.
  • Things Young People Dislike About Nashville: Traffic was overwhelmingly the most frustrating part of living in Nashville among youth survey participants, regardless of age, race and ethnicity, or type of school participant attends. Other common frustrations among Nashville youth participants include expensive to live in Nashville, homelessness, expensive housing, and crime/neighborhoods are less safe.
  • Ideal Neighborhood: Survey participants <11 years old, white, or attending private school reported the highest averages on a scale of 1 to 10 of how much their current neighborhood reflects their ideal neighborhood– 1 is neighborhood does not reflect ideal community at all and 10 is neighborhood reflects ideal community perfectly. Survey participants identifying as Black, other race or ethnicity, and two or more races/ethnicities, as well as participants who attend public school reported the lowest averages on that same scale.
  • Ingredients to an Ideal Neighborhood: The majority of youth surveyed (all ages, all types of school attend, and Asian, Black, Hispanic, white, and two or more races/ethnicities) believe that hospitals, affordable housing, grocery stores, and schools are all “absolutely essential” ingredients to an ideal neighborhood. Fire stations were also commonly identified by survey participants as an “absolutely essential“ ingredient for an ideal neighborhood.
  • Big Ideas about Nashville‘s Future: While “Strong Neighborhood“ was selected by survey participants across all age groups as the Big Idea that describes their hopes and dreams for Nashville‘s future, it was especially important for survey participants between 11 and 13 years old (31%). Older participants (14–18 years old) prioritized the Big Idea of “Learning.“ 39% of Black survey participants chose the vision of “Strong Neighborhoods“ as their Big Idea for Nashville’s future, which is higher than any other group. “Learning“ was also an important focus for the future of Nashville, especially for Asian, Hispanic, and White survey participants.

Link Here To Final Release

Survey Methodology

The section below describes the methodology used for the Dream City Workshop Phase II survey.

Dream City Workshop Phase II Survey Development

The Dream City Workshop Phase II survey was adapted from the Imagine Nashville adult survey developed by Heart + Mind Strategies. During the summer of 2023, the Nashville Youth Design Team (NYDT) adapted the adult survey questions to make them more accessible to young people. Revisions to the adult survey included cutting down the number of questions included in the survey and simplifying the language of the survey. After the survey questions were revised, they were programmed into a REDCap survey hosted at Vanderbilt University. REDCap (Research Electronic Data Capture) is a secure, web-based software platform designed to support data capture for research studies, providing 1) an intuitive interface for validated data capture; 2) audit trails for tracking data manipulation and export procedures; 3) automated export procedures for seamless data downloads to common statistical analysis packages; and 4) procedures for data integration and interoperability with external sources (Harris et al., 2009). The survey was piloted by eight NYDT members before it went live in August 2023. The Dream City workshop and survey were made available in English and Spanish. For other language supports, the Dream City staff worked directly with site facilitators to ensure accessibility for their students. Additional site-specific supports included either written or verbal translation into Arabic, Swahili, and Turkish.

Survey Dissemination

The survey was disseminated between August 2023 and March 2024 to young people between the ages of five and 18 years old who live in Davidson County, TN. The online survey was open to the public and was available online through REDCap. Paper surveys were distributed to Dream City Workshop participants following the design portion of the workshop. (See the section below for the process used when workshops were conducted in Metro Nashville Public Schools)

Dream City in Metro Nashville Public Schools (MNPS)

Prior to conducting workshops and disseminating surveys in MNPS classrooms, the project was approved by The University of the South‘s IRB and MNPS‘s Research Review Committee. Signed parental consent and youth participant assent were required prior to youth survey participation. Youth participants who did not sign and return both the parental consent and youth participant assent were given an alternative assignment, which is not included in this analysis. All youth were eligible to participate in the workshop regardless of parental consent.

Data Cleaning

Following data collection, survey submissions that did not complete at least 3 out of the six sections were removed from the study sample. The data was then exported from REDCap as a CSV and cleaned using Microsoft Excel. All submissions by individuals who were over 18 years old were removed from the study sample (n=17).

Age

The “Age” variable was recoded for consistency due to the open-ended nature of the question (18 vs. eighteen). A new variable, “Age Category,” was created based on the age groups: <11 years old, 11-13 years old, and 14-18 years old.

Race & Ethnicity:

Dream City survey participants shared that the race and ethnicity categories presented in the survey did not accurately represent the racial identities and experiences of all young people. For example, some participants who chose “Hispanic” for their ethnicity noted that they did not feel represented by the racial category of White. Therefore, when cleaning the data we chose to combine race and ethnicity into one variable, allowing students to indicate race or ethnicity or both. If a participant selected a race value but not an ethnicity value, their answers were coded as the race value. If a participant selected an ethnicity value, but not a race value, answers were coded as the ethnicity value. If a participant selected both a race and ethnicity value, they were coded as “Two or More Races/Ethnicities.” For example, 86 participants identified as MENA, however, 52 of those participants also selected another race and/or ethnicity, moving those participants from the MENA group to the “Two or More Races/Ethnicities” group.

How Many Years Have You Lived in Nashville?

The “Years Spent in Nashville” variable was recoded for consistency due to the open-ended nature of the question (11 vs. eleven).

Data Analysis

Pivot tables in Microsoft Excel were used to conduct basic descriptive statistics (averages, counts, percentages) on the data. No survey weights were used.